

Ethereum: How Low Can You Go?
As Bitcoin goes, so do all the altcoins! And even more so. This holds both for upside and downside. In a Bitcoin post from a few days ago, we have discussed potential bear market and consequent expected decline in price of Bitcoin.
As we prepare for Bitcoin bear market, we must also prepare for bear market in altcoins. While Ethereum is currently altcoin #1, it is still an altcoin. Altcoins tend to drop more than Bitcoin during downturns (in percentage terms, counting from their respective highs).
An all-time-high (ATH) price of Ethereum of roughly $4,800 has been achieved last year, in November 2021. Currently, Ethereum (ETH) trades around $1,750 which is roughly 64% drop from its maximum price (compared to 54% drop in Bitcoin from ATH). Can Ethereum go lower – it sure can. Is current price the bottom – probably not. I am not trying to predict where or how low the Ethereum price will go. But I can sure respond with my purchases at certain price levels if we do go south. I can develop a trading plan.
Since it is impossible to know the ultimate low in Ethereum price, we can at least pick what we think is the most reasonable bottom price. And what we pick will greatly depend on our personal circumstances and level of our investing aggressiveness or conservativeness. It doesn’t mean we will see the price we pick, but we will plan capital allocation strategy with such price as a potential bottom.
Spreading Capital across the Price Range
According to the principles of my investing strategy, capital is divided into multiple chunks and allocated across a range of prices at different price points. Thus the approach consists of two main steps, in which we need to figure out:
- The price range, that is Top and Bottom price (along with its distribution) and
- The amounts of capital allocated to each price point within the range
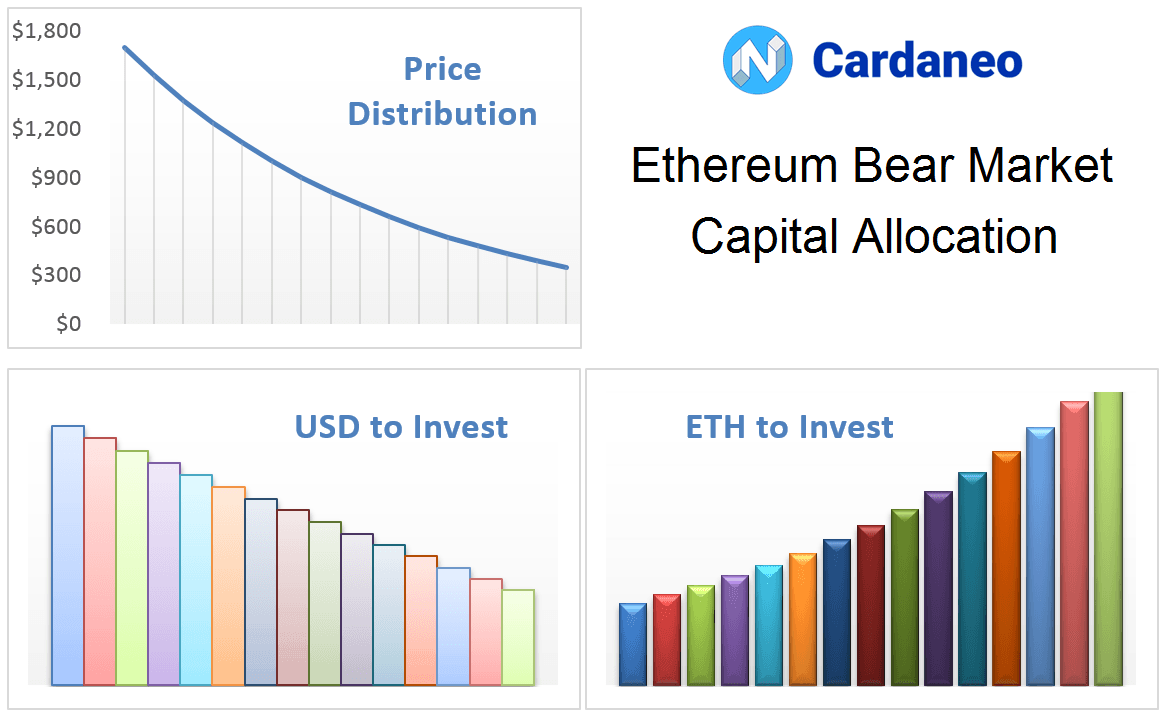
Here is an example of some nice charts representing US Dollar capital chunks and corresponding amounts of Ethereum (ETH) coin they can purchase at different price points:
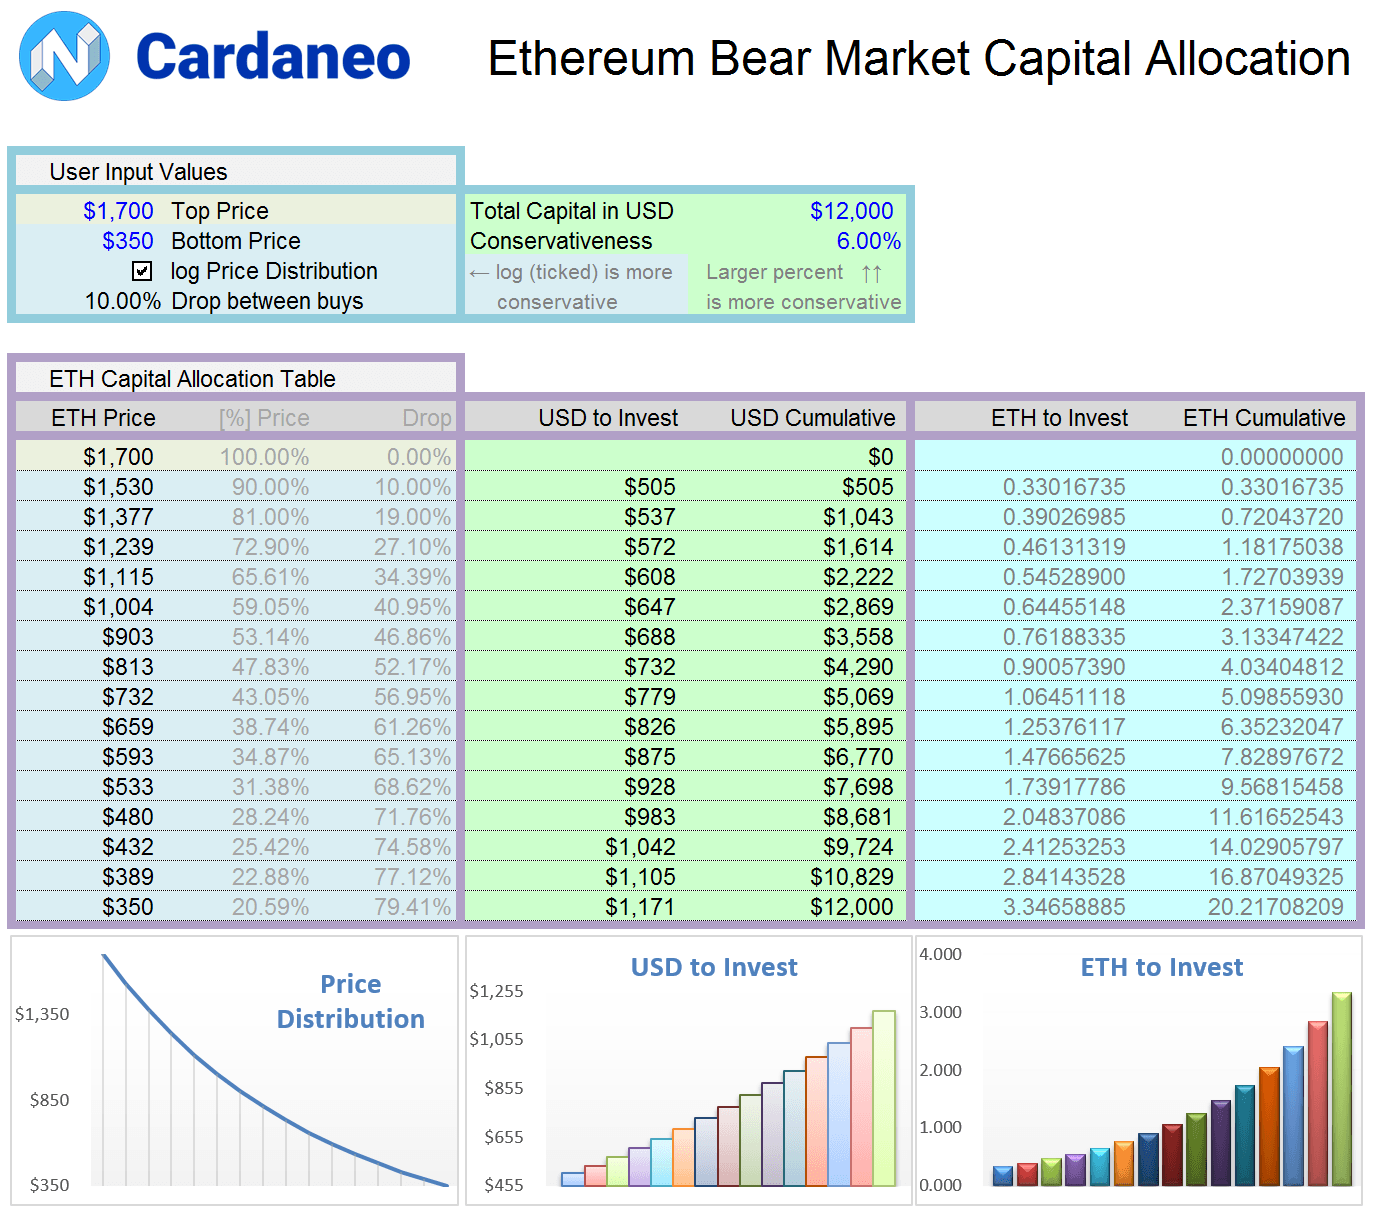
In the capital allocation table below, you can see that the price range covers 15 price levels. In other words, I chose to divide the capital into 15 chunks to reduce the risk of “capital plopping” at any single price point. I have proposed certain default values for the price range (Top and Bottom prices) that can be changed in the spreadsheet as part of user input values.
In the capital allocation table for Bitcoin, we worked with two major bear market price levels (Mid Price and Bottom Price). This time, I decided to give you a simpler and slightly different approach – just a single price, yet I developed more powerful control of capital allocation!
How low the actual Ethereum price drops determines how much of the capital ultimately gets deployed. Most of the time, not all capital is used as the price never drops to the bottom of the capital allocation table.
Capital Allocation Table and Spreadsheet
Spreadsheets are the most convenient way for me to plan allocation of trade capital. I normally use MS Excel, but any spreadsheet software will do the job. For this specific post, I have developed a table that shows number of different Ethereum price points with corresponding amounts of Dollars to be invested at each price point as the price keeps dropping.
Screenshot of the table is given in the image below:
You can also download actual Excel spreadsheet file HERE. The file is zipped as it contains a macro. If you have technical issues using the spreadsheet, you can refer to my blog post with some ideas to troubleshoot this process.
In the spreadsheet I have used certain assumptions about Ethereum prices and desirable distribution of individual Dollar amounts allocated to each individual price. You can use the default values, but also feel free to change anything you see fit and let the spreadsheet do the calculations for you. Cells with blue text/numbers are meant for spreadsheet users to fiddle and experiment with.
Once you have your final table figured out, you can save it or print it for future reference as a part of your trading plan. It may take months for price to go through some or all the price levels you settled upon. Being systematic and having patience are two key components in investing.
How to Use the Capital Allocation Spreadsheet [Video]
To better understand how to use the spreadsheet and how changing certain values affects the capital allocation, please watch the following video: